
LiDAR Mapping for Flood Zone Analysis: A Developer’s Practical Guide
Floods don’t care about property values. They follow elevation. And if your site data is wrong by even half a meter, your flood model is wrong too.
That’s the core problem with traditional surveys over large parcels. They’re slow, expensive, and can miss subtle terrain features that determine where water goes. LiDAR fixes that. It gives you dense, accurate elevation data across wide areas, fast. For developers doing flood zone analysis, it’s now the baseline standard, not a premium option.
Here’s what you need to know to use it properly.
What Is LiDAR, and Why Does It Matter for Flood Analysis?
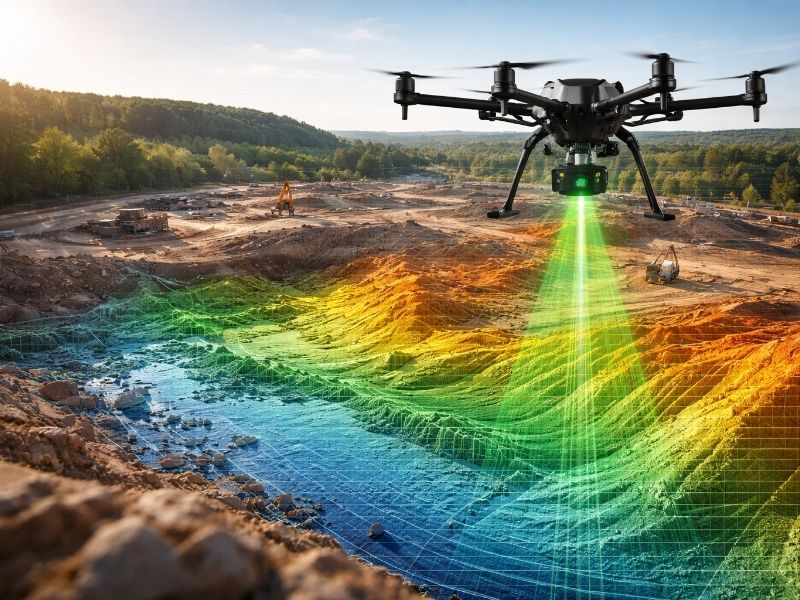
LiDAR mapping works by firing millions of laser pulses at the ground from an aircraft or drone. Each pulse bounces back. The system records the return time and calculates the exact distance to the surface. LiDAR stands for Light Detection and Ranging. An aircraft or drone fires millions of laser pulses at the ground. Each pulse bounces back. The system records the return time and calculates the exact distance to the surface.
The output is a point cloud: a dense 3D map made of hundreds of millions of individual data points. Each point has an X coordinate, a Y coordinate, and a Z coordinate (elevation).
For flood analysis, elevation is the variable that matters most. A 20-centimeter error in a DEM can shift a flood boundary by hundreds of meters on flat terrain. LiDAR reduces that error to 10 centimeters or better under standard airborne conditions.
How LiDAR Data Gets Used in Flood Modeling
Step 1: Point Cloud to Digital Elevation Model (DEM)
Raw point clouds are processed into a Digital Elevation Model. A DEM strips out trees, buildings, and vehicles using classification algorithms. What’s left is a bare-earth surface.
That bare-earth grid feeds directly into hydraulic simulation software. Programs like HEC-RAS, TUFLOW, and MIKE FLOOD use DEMs to predict where water flows, how deep it gets, and how long it sits.
The finer the DEM resolution, the better the flood model. A 1-meter DEM is solid for most site-level work. A 25-centimeter DEM is better for drainage infrastructure design.
Step 2: Identifying Flow Paths and Problem Areas
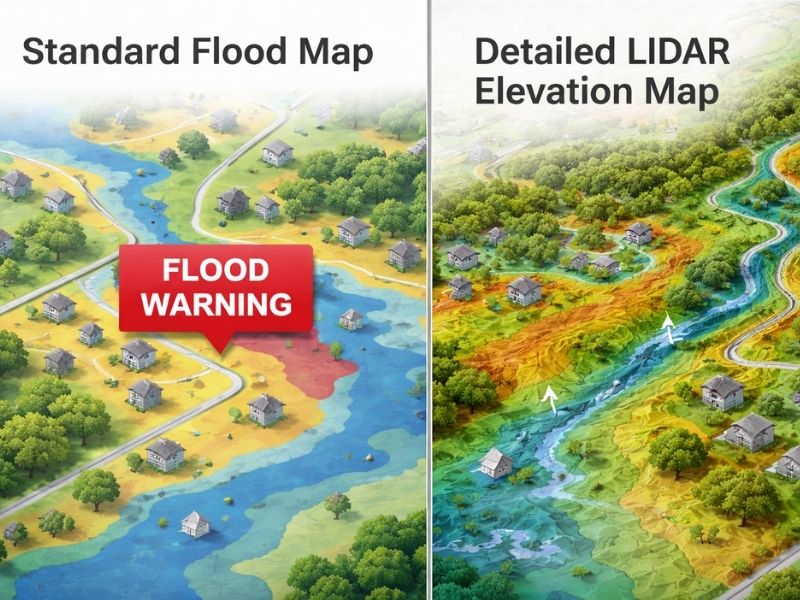
LiDAR reveals what standard topo maps can’t: subtle depressions, natural drainage channels, and culvert inlets. Water always follows the lowest path. LiDAR makes those paths visible before construction starts.
A site that looks flat on a 5-meter contour map might have a 40-centimeter drainage swale running through it. That changes your grading plan entirely.
Step 3: Pre- vs. Post-Development Comparison
Developers use LiDAR-based models to compare existing versus proposed conditions. If you add 8,000 square meters of impervious surface (rooftops, paving, car parks), runoff volume increases. LiDAR lets engineers model exactly where that extra water goes before a single trench is dug.
Regulatory bodies in many jurisdictions now require this comparison as part of the planning approval process.
LiDAR vs. Other Survey Methods
Airborne LiDAR is the workhorse for regional flood analysis. It covers hundreds of square kilometers per day with a vertical accuracy of 10 to 15 centimeters. That’s fast enough and precise enough for most flood modeling work across large parcels or catchment areas.
Drone LiDAR trades coverage for detail. It covers 1 to 5 square kilometers per day, but accuracy tightens to 2 to 5 centimeters. That level of resolution works well for site-level drainage design where small elevation differences actually matter.
Ground surveys are the slowest option at 5 to 10 hectares per day. The tradeoff is sub-centimeter accuracy. Use them for small areas, legal boundary work, or to verify benchmarks that other methods flagged as uncertain.
Photogrammetry sits in a different category. It’s fast and works from aircraft or drones, but accuracy drops under tree canopy. Expect 5 to 15 centimeters on open terrain. Avoid it where dense vegetation covers the site.
For broad flood zone analysis, airborne LiDAR is the right starting point. For detailed drainage design at the site level, drone LiDAR or a targeted ground survey fills the gaps.
Where to Get LiDAR Data
You don’t always need to commission a new survey. Many governments publish open LiDAR datasets:
- United States: USGS 3DEP (3D Elevation Program) covers most of the country with 1-meter resolution data. Access it at apps.nationalmap.gov.
- United Kingdom: The Environment Agency publishes 1-meter and 25-centimeter LiDAR for most of England at no cost.
- Australia: Geoscience Australia’s ELVIS platform provides elevation data for large parts of the country.
- European Union: The Copernicus Land Monitoring Service offers 10-meter and 25-meter DEMs across Europe.
Check two things before downloading: collection date and point density. Data collected before major development or after a significant flood event may not reflect current ground conditions. Aim for data collected within the last 3 to 5 years for active development sites.
What Developers Should Ask Before Using LiDAR Data
Before your engineer submits a flood report built on LiDAR, ask these four questions:
- What is the vertical accuracy of this dataset? You want 15 centimeters or better for flood modeling.
- When was the data collected? Anything older than 5 years on a developed site warrants field verification.
- Has it been ground-truthed? Benchmark checks against known survey points confirm the data is reliable.
- What hydraulic model was used? HEC-RAS, TUFLOW, and MIKE FLOOD are industry-standard. Proprietary or undocumented tools are a red flag.
Those questions protect you. A flood report that looks polished but uses poor input data will cost you far more later.
What LiDAR Cannot Do
LiDAR maps terrain. It doesn’t map:
- Underground pipe networks and drainage infrastructure
- Soil permeability and infiltration rates
- Future climate scenarios or changing rainfall intensities
- Legally designated flood zones (those come from regulatory authorities)
Flood risk is not terrain alone. A complete analysis combines LiDAR-derived DEMs with stormwater records, soil surveys, drainage plans and local authority flood maps. LiDAR is the foundation. It’s not the whole structure.
Frequently Asked Questions
Is LiDAR-derived elevation data accepted for regulatory flood assessments?
Yes, in most jurisdictions. Many planning and drainage authorities accept LiDAR data if it meets their published accuracy standards. Confirm acceptance with your local authority before commissioning a report. Some jurisdictions require a licensed surveyor to certify the data before submission.
How much does a LiDAR survey cost?
Airborne LiDAR surveys typically range from $500 to $1,500 per square kilometer. Drone-based surveys for smaller sites run between $2,000 and $10,000, depending on area, resolution, and deliverable specs. Free government datasets are worth checking first.
How old is too old for LiDAR data?
For undisturbed rural land, data 5 to 7 years old is usually acceptable. For land near active construction, new drainage works, or recent storm events, aim for data collected within the last 2 to 3 years. When in doubt, commission spot ground checks at key drainage points.
Can LiDAR see through tree canopy?
Partially. Airborne LiDAR fires multiple pulses per second. Some pulses pass through gaps in the canopy and return a ground hit. Processing software uses these ground returns to build the bare-earth DEM. Dense tropical or coniferous canopy reduces ground hit density, so accuracy drops slightly in heavily forested areas.
Do I need a licensed surveyor to use publicly available LiDAR data?
For early-stage feasibility and desktop analysis, no. For documents submitted to regulatory bodies (flood certificates, drainage reports, planning applications), yes. Licensed professionals are required to certify elevation data for legal purposes in most jurisdictions.